
By the results, there was nothing out of the ordinary with Mariano Rivera’s 2010 season. He hit a couple of rough patches, including a period early in the season where his ribs prevented him from pitching in games, but at the end he had delivered his customary sub-2.00 ERA. His peripherals also came close to his 2009 numbers. The biggest difference was in his strikeouts, down to 6.75 per nine. While we typically regard Mo as immortal around these parts, I wouldn’t blame anyone for asking whether this forecasts some trouble for 2011.
While Mo’s strikeout numbers were down across the board, the biggest difference came against left-handed hitters. He still struck out 31 of the 120 righties he faced, 8.90 K/9, but he struck out only 14 of 110 lefties, 4.40 K/9. In 2009 he struck out 35 of 130 lefties faced, or 9.45 per nine. Mo has always been particularly tough against lefties, getting them to hit dinky grounders and humpback liners in addition to the swings and misses. Might this decreased effectiveness against lefties affect his 2011 performance?
In order to determine the answer we have to find the reason why Mo was less effective in striking out left-handed hitters in 2010. Unfortunately, this is not a question which we are readily equipped to answer. It’s more of a scouting issue, and while we’ve learned plenty by watching hundreds of games every year, this is still a question that is better directed towards a trained scout. In fact, it would probably be best answered by multiple scouts, since the differences can be so subtle and nuanced that different people might see it in different ways. But we do have one tool at our immediate disposal: FanGraphs heat maps.
This morning FanGraphs proprietor David Appelman introduced a customizable heat map tool that will make for many pretty visualizations. In his initial post he used Mo as an example. Yet he uses the red-to-yellow heat scheme, and hasn’t set the intensity particularly high. When examining Mariano’s cutter against lefties in 2009 and 2010 I turned the intensity all the way to 100, and changed the format to display more colors. That should give us a better visual idea of what he did in those two years.

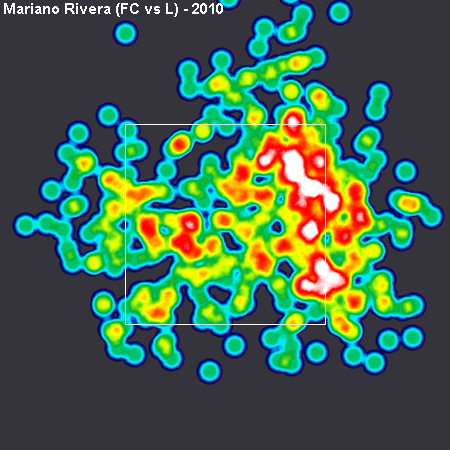
The most noticeable difference comes on the pitches slightly out of the zone. In 2009 he spotted the cutter just out of the zone to lefties. It’s harder to hit a ball out of the zone, and we know that lefties have a hard time when Rivera throws his cutter inside. In 2010 you see a concentration of cutters up and in to lefties, but there isn’t that same concentration of balls that run just out of the zone — inside pitches to lefties. We can’t say for sure that this is the sole cause, but it certainly appears to be part of the answer.
Another neat little feature of these heat maps is that it provides pitch type splits. Check out Mo’s four-seamer. He used it effectively against lefties in 2009 when he wanted to pitch them away. In 2010, though, he hardly touched the pitch against lefties. That also might be part of the answer. Perhaps Mo needs to use that fastball to keep lefties guessing.
Again, these heat maps don’t provide us with answers. Instead they put data into a format that we can easily see. Maybe Mo’s lack of strikeouts against lefties had nothing to do with where he spotted his cutter. But more than likely I expect it played a part. That’s his bread and butter, and he just wasn’t ramming the cutter down lefties’ throats as he has in the past. I suspect that he’ll get back to that in 2011.
Leave a Reply
You must be logged in to post a comment.