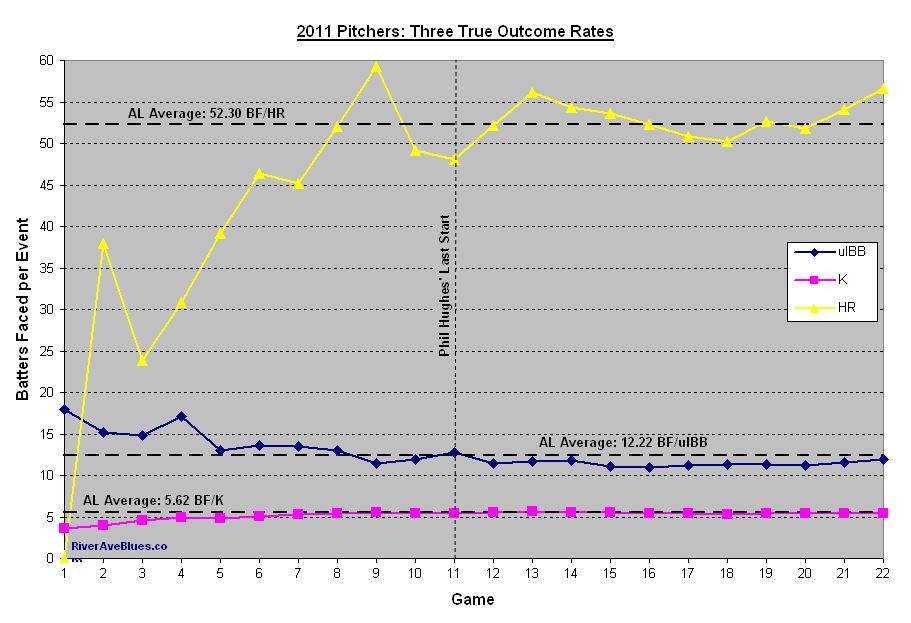
As I said this earlier this afternoon, I’m a sucker for homers, walks, and strikeouts. We know the Yankees’ are hitting homers and drawing walks at an above average rate (considerably so in the case of the long ball) while maintaining a league average strikeout rate, but what about the pitching staff?
The graph above is the pitching version of the graph I used earlier, with the stats expressed in terms of batters faced per events. Remember to click it for a larger view. You want the homer and walk rates to be high (more batters faced per HR or BB) while the strikeout rate should be way down low. Again, the AL averages I’ve listed do not include the Yankees, so we’re comparing them to the other 13 AL clubs.
Let’s run through it quick, since the graph is pretty self explanatory. The Yankees are slightly better than league average when it comes to strike outs, we’re talking 5.48 BF/K compared to 5.62 BF/K. Their unintentional walk rate is actually worse than league average, just under twelve batters faced per walk. The homerun rate has been up and down all year, but it’s settled down of late and right now sits about four batters faced per homer better than the average. Believe it or not, the Yankees’ pitching staff has the eighth best FIP in baseball (3.64), and their staff ERA essentially matches (3.72). April’s a good time for stats, eh?

Leave a Reply
You must be logged in to post a comment.