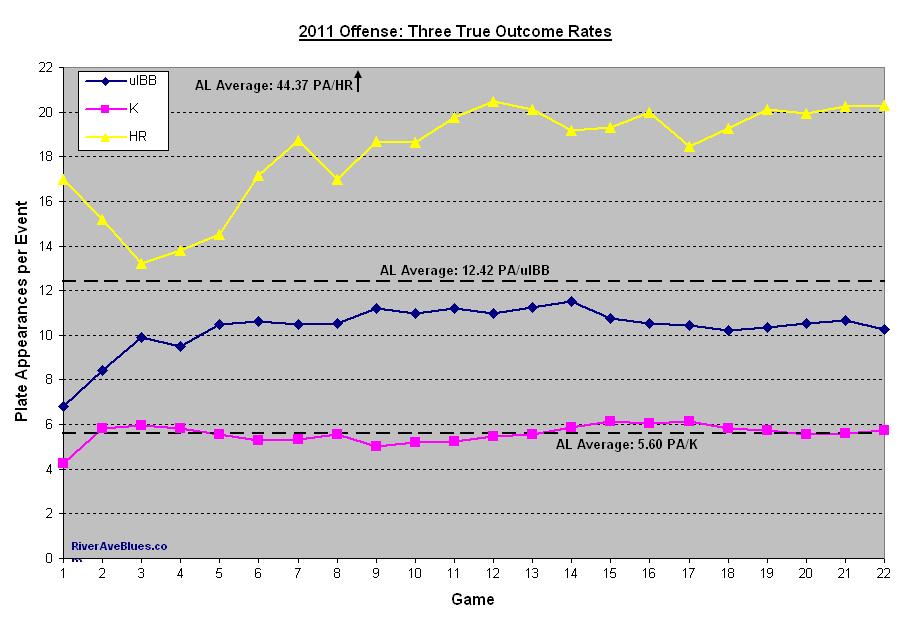
I obsess probably a little too much over the three true outcomes, meaning walks (preferably unintentional), strikeouts, and homers. All three events take the defense right out of the equation, and every so often I check out how the Yankees are doing in each department compared to league average. That’s what you see in the graph above, and I recommend clicking it for a larger and easier to read view.
Strikeout rate typical stabilizes around 150 plate appearances while it takes walk rate about 200 or so. Homerun rate needs a bit more time, right around 300 plate appearances. For a player, that’s anywhere from a quarter to half a season, so we shouldn’t get too worked up about Robinson Cano’s 1.1% (!!!) walk rate for another 100-110 plate appearances or so. When you look at the entire team though, we get to these stability points much more quickly. In fact, we’re already north of 800 plate appearances for the Yankees as a whole, which is the second fewest in the American League. That has more to do with all those rain outs and off days than anything else.
The graph shows the team’s cumulative strikeout, unintentional walk, and homerun rates in terms of plate appearances per event. So ten plate appearances per strikeout, something like that. You want the uIBB and HR rates to be low but the K rate to be high (that means more PA per strikeout, so they’re happening with less frequency). As you can see in the graph, they’ve hovered right around the league average in strikeout rate all month, whiffing once every 5.75 trips to the plate, give or take a tenth of a plate appearance. That’s reasonably in line with last year’s 5.62 PA/K, which again was almost exactly league average.
As for the unintentional walks, New York batters are comfortably better than league average. They’ve worked an unintentional walk once every 10.27 plate appearances in 2011, more than full PA better than average. That’s the second best rate in the league, bested only by the Red Sox at 9.68 PA/uIBB. Forget about the homerun rate, the Yankees are off the charts good there. At 20.29 PA/HR, they’re more than double to league average of 44.37 PA/HR. That’s crazy. Add in the fact that they’re not striking out at an ungodly pace (more power, more strikeouts, that’s just the way it goes), and it’s a pretty impressive offense when you remove things the defense impacts. Of course it hasn’t looked that way over the last week or so, at least not up until last night.
Note: Just to be clear, I removed the Yankees from the league average calculation. So we’re effectively comparing the Yankees to the other 13 AL teams.

Leave a Reply
You must be logged in to post a comment.