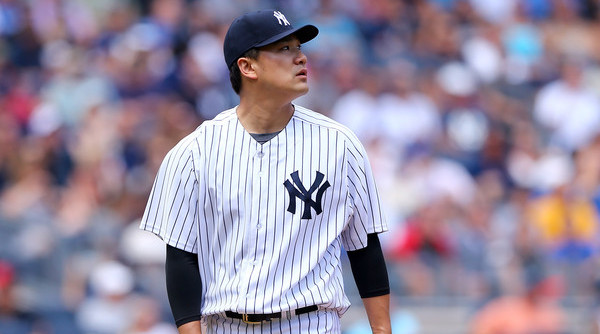
Over the course of the 2015 season, it’s hard to argue that anyone other than Masahiro Tanaka has been the Yankee best and most consistent starter. Sure, we could argue that CC Sabathia’s been more consistent, but I’m trying to keep things positive here. Should the Yankees be “forced” to play in the Wild Card play-in game for entry into the ALDS, we can only hope that Tanaka is lined up to start that game; why there’d be any question about this is definitely beyond me. But despite Tanaka’s general goodness at delivering pitches, there’s been a noticeable wrinkle in his game this year: the dinger.
On the year, Tanaka has given up 24 home runs, ninth most in the AL. Shockingly enough, Phil Hughes leads the AL with 29 homers surrendered (though he shares that “distinction” with Anibal Sanchez); Sabathia and his 27 homers are good for fifth. Giving up that many homers is a problem in and of itself, but it’s compounded by the fact that Tanaka’s 17.0 HR/FB% is the worst in the AL among qualified starters (Sabathia is second worst at 16.6). In 2014, homers were also Tanaka’s one-bad-thing; he gave up just 15, but that was in a relatively short amount of time. His HR/FB% last year was better than this year’s at 14.0%, but still high; in fact, it also ‘led’ the AL, clearing the second place finisher (Hisashi Iwakuma, 13.2%) by almost a full point. Given that Tanaka uses a splitter as his main out-pitch, this data makes a bit of sense. His ground ball rates of 46.6 and 47.3% are fairly high, so it’s rare when Tanaka does give up fly balls. The problem is that when he does, they seem to travel a long, long way. While 2014 and 2015 were relatively similar with regards to the long-ball and TANAK, there is one rather striking difference: the way lefties are ripping round-trippers off of the righty.
In 2014, Tanaka gave up a larger percentage of his HR/FB to right handed batters: 15.4% against them and “just” 12.7% against lefties. This year, that trend has reversed itself drastically: 13.6% against RHB (still not good!) and 22.6% (!!!) against lefties. For a microcosm of this issue, we need to look no further into the past than his last start against the Mets on Friday night.
That night, Tanaka threw just three bad pitches. One of them was a double down the right field line by Lucas Duda that eventually led to nothing for the Mets. The other two, however, represented the only runs Tanaka gave up (click to embiggen all images):
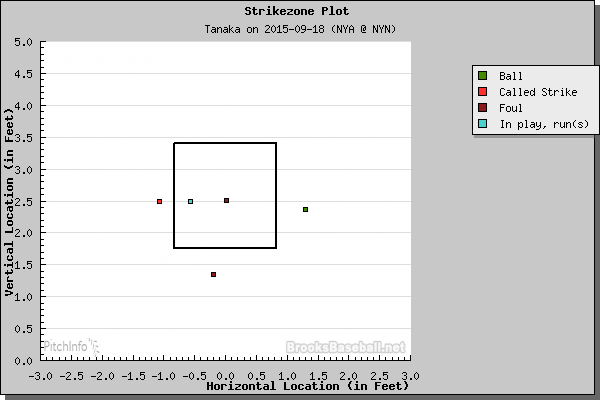
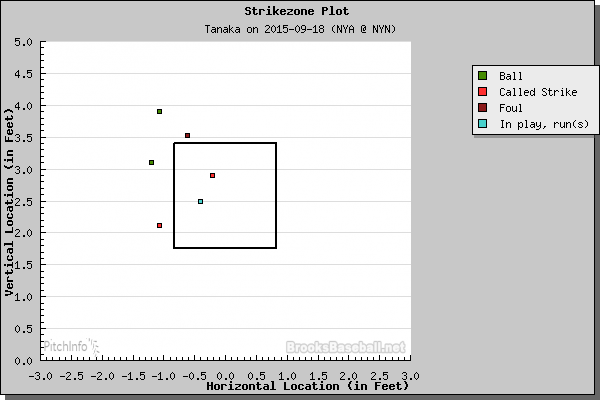
The first image is the home run Tanaka gave up to aforementioned Duda. The second is the one he gave up to Daniel Murphy, which put the Mets ahead for good. Both pitches are right in the middle of the plate and the lefties were able to hook them into (deep) right field both times. Both pitches, in fact, are almost in the exact same location, with Murphy’s just a touch closer to the plate. Generally, though, they’re in the same portion of the strikezone. If those pictures were broken down into a 3×3 strike zone grid, they’d be in the same box. So two different hitters, ones whose only real similarity is that they hit from the same side of the plate, hit basically the same-located pitch over the fence. This couldn’t be a coincidence, could it? Well, if it were, you’d be reading something else here. It turns out that this location has been a trouble spot for Tanaka. Take a look at the strike zone grids below that represent the left-handed batters’ collective ISO against Tanaka, broken down by strike zone location. 2014 is first, followed by 2015.
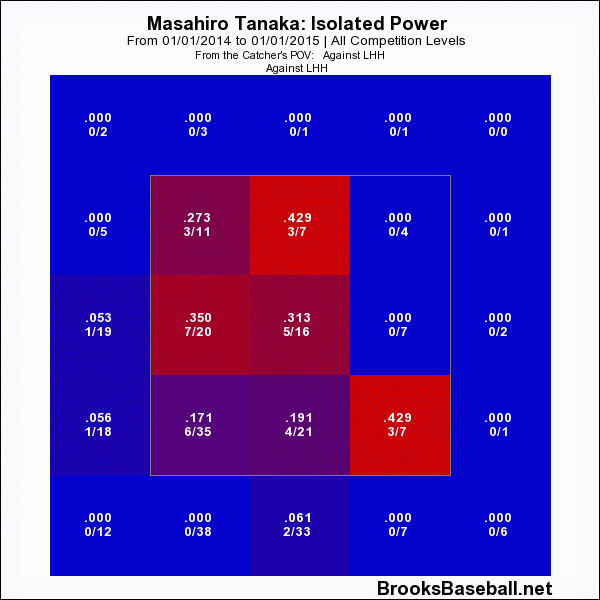
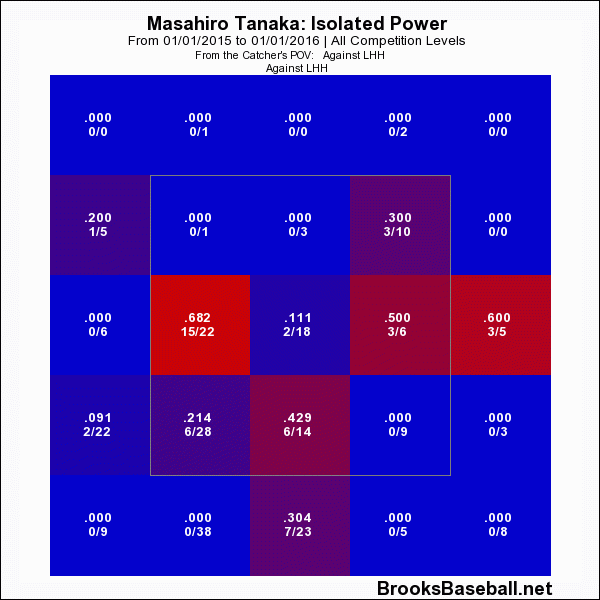
Take a look at the box where the two homers from Friday night would sit. In 2014, lefties tagged Tanaka to the tune of a .350 ISO in that spot. As if that wasn’t high enough, this year, batters are crushing pitches in that location: .682 (!!!). That’s the what, but what’s the why? Like the HR/FB% issue, we can likely point to Tanaka’s repertoire as the “culprit” for this.
Tanaka gets most of his swings and misses on his slider and his splitter; his Whiff/Swing percentages on those pitches are 33.33 and 33.89 respectively. Against LHB, those numbers are even higher: 37.29% and 35.24%. So, why the big time homer numbers against lefties? And why the big time power in that outside location? Think of the action of each one of those pitches. It’s possible that some (attempted) backdoor sliders are getting just too much of that outside corner and lefties are mashing them. The same could be said for splitters looking to drop out of the zone that hang just a bit too much. Taking a look at the outcomes of each pitch against lefties, we can see that the slider and splitter have relatively low HR/(FB+LD) marks at 12.5 each and that the fastball has been the biggest victim (30.77). The curveball (20.00) has also been sent over the fence more than the slider and splitter. While those numbers aren’t broken down by location, they’re also pitches that a righty will try to place on the outside to a lefty. It seems, then, that when Tanaka is trying to locate those pitches in that middle/away box, he’s not getting the movement on his breaking pitches that he wants, nor is he getting the command on his fastball. That combination generally leads to bad things and that’s certainly been the case for Tanaka and his homers in 2015.
Leave a Reply
You must be logged in to post a comment.