Maybe you haven’t noticed, but the Yankees have done a lot of scoring early in games this season, but not so much later in the game. They’ve put 65 runs on the board in innings 1-3 through the first 26 games of the year, but just 79 runs in innings 4+ (including extra innings). Given the team’s modus operandi of “work the starter then go to town on the bullpen,” you’d expect that to be a little more balanced out.
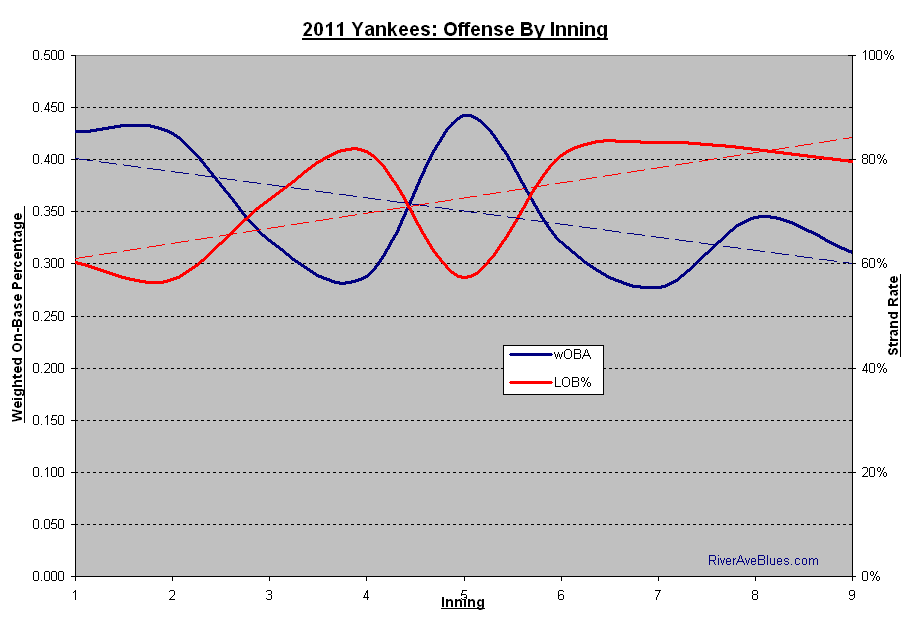
The graph above (which you can click for a larger view) shows two things in relation to each other. The first vertical axis (the blue line with dashed trendline) is the team’s wOBA while the second (the red line with dashed trendline) is the team’s left-on-base percentage, both by inning. I left extra innings out of it because the Yankees just haven’t played many of those, thankfully. The peaks and valleys in the wOBA line have to do with the batting order; the peaks are when Curtis Granderson, Mark Teixeira, Alex Rodriguez, and Robinson Cano are typically at the plate, the valleys are basically everyone else. I’m not sure why it drops off so much in the 8th and 9th innings, but a .350-ish wOBA is still well-above average. The Yankees are still producing with the bats in the late innings, there’s no doubt about that.
It makes sense that the LOB% line would be the opposite of the wOBA line, the more offense the team is producing, the fewer runners they’ll strand. So that should be down when the wOBA is up, and vice versa. But at the end of the game, from the sixth inning on, the strand rate has plateaued at more than 80% for some mysterious reason. The league average strand rate is 72.1% and has been right around that number for the last few years, so the Yankees are running into some bad luck here. Stranding runners is not a repeatable skill (unless you have a pitcher with a 1.0 batters faced-to-strikeout ratio), so this is something that should even out as the season progresses. More late inning rallies are the way … at some point.

Leave a Reply
You must be logged in to post a comment.