All throughout the week, the fine folks at Baseball Prospectus are rolling out a slew of new pitching metrics. They’re attempting to measure things that were previously unmeasurable, like command and deception and the effects of pitch sequencing. Last year they revolutionized catcher defense stats, and now they hope to do the same with the guys on the mound.
Two of the tools the BP crew rolled out earlier this week are stats that serve as proxy measurements of control and command. Control is the basic ability to throw strikes. Command is the ability to throw quality strikes, meaning hit the corners of the zone and keep the ball out of the heart of the plate. You can have good control and bad command. Example: Michael Pineda. He rarely walks hitters, but he also struggles to keep the ball out of the middle of the zone.
The article explaining the new stats is free to read, so I recommend checking it out. In a nutshell, Called Strike Probability, or CS Prob, measures control by telling us the likelihood of a pitch being called a strike based on all the other pitches in that location around the league. Called Strikes Above Average, or CSAA, reflects command by telling us whether a pitcher is reliably hitting his spots. CSAA is adjusted for the catcher, umpire, the whole nine. It isolates the pitcher’s contribution to the called strike (or ball).
After scrolling through the leaderboards, the data told me pretty much exactly what I expected. Pineda rates very well in CS Prob and very poorly in CSAA. Dellin Betances rates below-average at both. I’m not sure that will surprise anyone. I was looking through various Yankees pitchers and it all made sense. And then I got to Masahiro Tanaka. Look where he ranks among pitchers to throw at least 100 innings:
| Pitchers with 100+ IP | CS Prob Rank | CSAA Rank | |
|---|---|---|---|
| 2014 | 149 | 134th | 32th |
| 2015 | 141 | 123rd | 10th |
| 2016 | 144 | 78th | 20th |
According to the data, in each of his three seasons with the Yankees, Tanaka has ranked in the bottom half of the league in control but near the top of the league in command. That doesn’t make sense! Intuitively, a pitcher can have good control and bad command, but not bad control and good command. If you can command your pitches and dot the corners of the zone, surely you can throw strikes.
So obviously the CS Prob and CSAA data is wrong, right? The stupid made up numbers are broken and the statheads are ruining the game. Yeah, sure, that’s always possible. Before we jump to that conclusion, we should consider exactly what CS Prob and CSAA are attempting to tell us first. CS Prob is quite simply “how likely is it this pitch will be called a strike?” CSAA is a tad more complicated. From the primer article:
Traditionally command is understood as the ability to “hit your spots”—having the ball end up where you intend it to. Over the years this has been studied in numerous ways—most notably by attempting to determine how much the catcher moves his glove to receive a pitch. This is flawed because the catcher’s glove isn’t always the target, and we can’t know where the pitcher is truly intending the pitch to go.
What we can do is come at command from a different angle. A pitcher with good command should be more predictable for the catcher—their pitches often end up in the locations, and with the movement that the catcher expects. This skill results in easier receiving for catchers, and additional called strikes for the pitcher. Once we aggregate the data cross thousands of pitches, CSAA is able to tell us whether a pitcher is reliably hitting his spots.
That make sense? CSAA measures the extent to which the pitcher affects the likelihood of the pitch being called a strike. The BP crew admits CSAA is not a perfect measure of command, but they’ve found the CSAA leaderboard reflects command pitchers very well. Guys like Zack Greinke and Kyle Hendricks are the CSAA kings while others like Betances and Pineda rank among the league’s worst. It passes the sniff test.
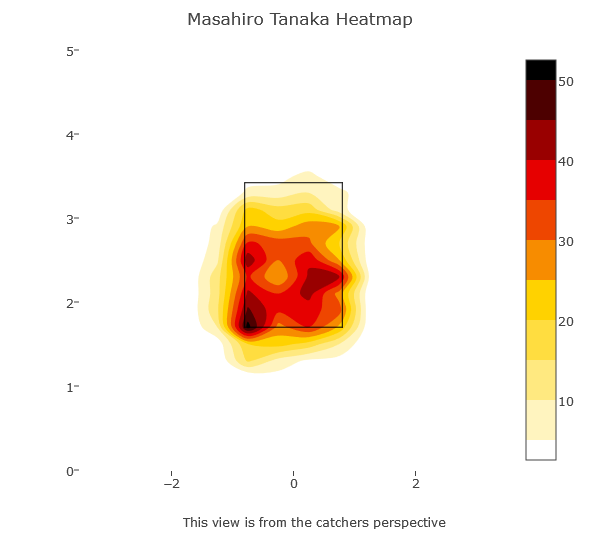
We know for a fact Tanaka rarely walks batters — he had a 4.5% walk rate in 2016 and it’s 4.3% in his three MLB seasons — indicating good control. The guy throws strikes. Having watched him pitch with my own eyes the last three seasons, it seems Tanaka lives on the corners of the strike zone. Here, via Baseball Savant, is a heat map of his called strikes since 2014:
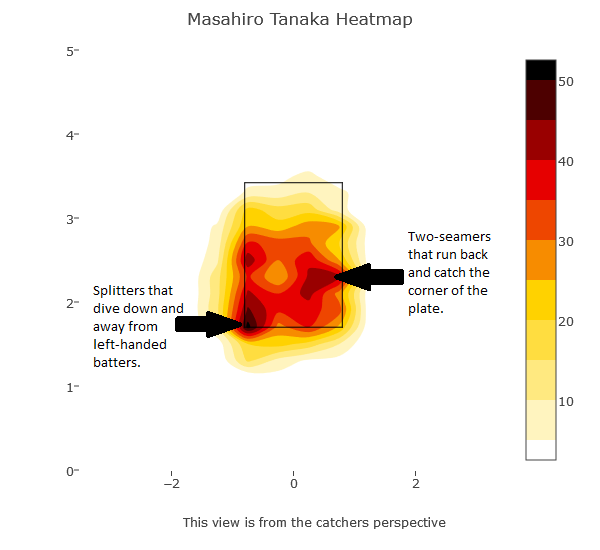
Look at that. It’s beautiful. The dark splotches, which indicate where the majority of Tanaka’s called strikes are located, are on the edges of the strike zone. The lightly shaded areas indicate fewer pitches in that location, and for Tanaka, that includes the middle of the strike zone. Every pitcher wants to control the strike zone that way. Live on the corners, stay out of the middle of the plate. Here, I’m going to label the heat map to make things a little more clear:
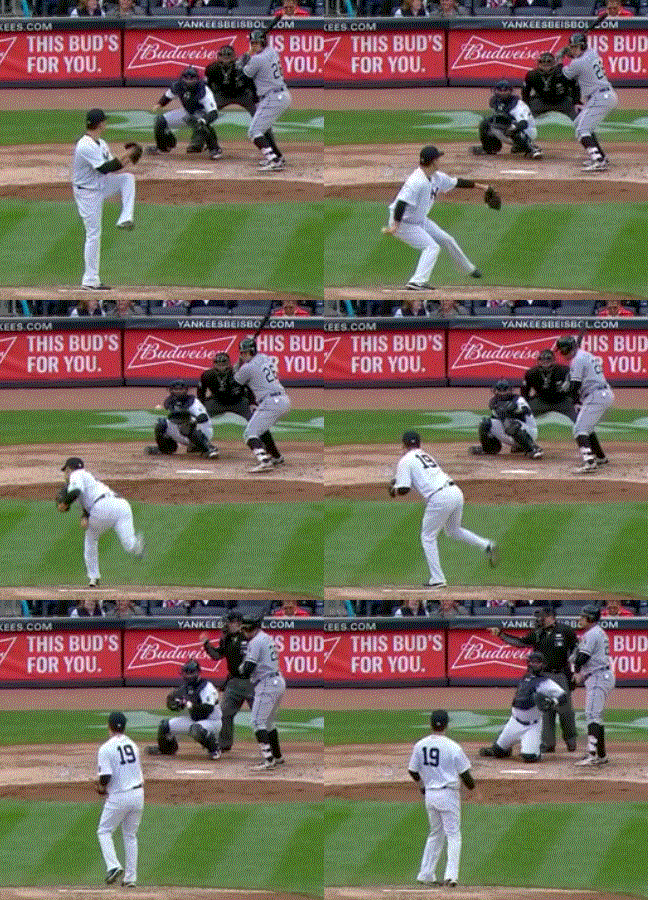
 That’s what you’re seeing in the heat map, essentially. If you’ve watched Tanaka pitch at all these last few years, you know he loves to throw that running two-seamer away to righties and in on lefties, and have it dart back over to plate to nip the corner for a called strike. Like this:
The pitch looks like it’s going to sail way outside to a right-handed hitter — or way inside to a lefty — before moving back over the plate to catch the corner. It’s a wonderfully effective pitch, and generally speaking, that’s the splotch on the left side of the heat map. The lower right blob is splitters — and possibly some sliders and curveballs too — and they’re pretty self-explanatory. They sometimes hit the bottom corner of the zone for a called strike, though they usually dive out of the zone for a swing and miss.
The CS Prob and CSAA data is not broken even though it’s indicating Tanaka has bad control but great command. Tanaka is just an outlier. We know he throws strikes. His consistently low walk rate is evidence of that. The assumption he has good command has always been based on our observations, but now we have some data telling us that yes, Tanaka is reliably hitting his spots. He lives on the edges of the plate, and because those pitches are less likely to be called strikes, his CS Prob rank is poor. But because he’s on the edges consistently, his CSAA is high. Make sense?
For most pitchers, their heat map of called strikes looks like a giant blob over the middle of the plate. Tanaka’s is the opposite. He keeps the ball out of the middle of the strike zone — not all the time, of course, but much more than most — and instead works the edges. That’s why he’s so successful despite not having a blow-you-away fastball. Tanaka is an artist on the mound. We’ve seen it the last three years. Now the CS Prob and CSAA data is confirming what our eyes have been telling us.


Leave a Reply
You must be logged in to post a comment.