Now that we have discussed our favorites among defensive, offensive, and pitching stats, we’re going to move onto a more general one. Today I’m going to explain Win Probability Added, or WPA, and Leverage Index, or LI. Both are pretty simple concepts, but we use them enough on RAB that I’d like to add it to our stats guide.
Quick terms
I like the term WPA, because it accurately describes what the stat tells. You’ll also see me talk about WE, or Win Expectancy. Put simply, WE represents a team’s chances of winning at any point in the game, and WPA represents the play-by-play swing in WE.
Calculating win expectancy
It’s the bottom of the fifth, two outs, runners on first and third, home team down by one. What are the chances of the home team winning that game? Thanks to the abundance of freely available data, we can pore through historical records and find out. (Where would we be without Retrosheet?) With over 70,000 games played since 1977, we have plenty of data to draw from.
The answer to the above question, according to Walk Off Balk’s Win Expectancy Finder, is that the home team won 42.9 percent of the time. If the batter singled in the runner from third, tying the score and placing runners on first and second with two out, the home team’s win expectancy rises to 57.1 percent, or a 7.9 percent swing. When we calculate Win Probability Added, the hitter gets credited with .079, and the pitcher gets debited.
As we’ll see in a second, however, this particular Win Expectancy Finder contains certain flaws.
Stripping out bias
I first started following WPA in 2005 when I wrote some blog that no one read. To calculate it I used Dave Studeman’s WPA spreadsheet, which was based on the Win Expectancy Finder. All I had to do was input the game’s play-by-play results, and the spreadsheet would track WPA throughout the game, assigning blame and credit to pitchers and hitters, and in the end creating a neat graph. It seemed like the perfect implementation.
Then, when RAB started in 2007, I discovered FanGraphs. They tracked the Win Expectancy of all games, basically doing the job the spreadsheet did. Since I had switched to a Mac that winter, and since Studes’s spreadsheet didn’t work on Excel 2003 for Mac, I found this a viable solution. Yet there are differences in how FanGraphs calculates Win Expectancy and how the WE Finder does.
The biggest difference between the two is run environment. Some years teams score more runs than others. I’m not sure if the WE Finder adjusts for this, depending on the year range you select, but FanGraphs does. The site uses the most up-to-date Win Expectancy tables, while the WE Finder runs only through the 2006 season. Those all help the accuracy of FanGraphs’s WPA measures.
The final aspect might seem a bit controversial to some, but it’s really not. In the WE Finder, the game begins already slanted to the home team. Since home teams won 54 percent of games between 1977 and 2006, the game starts with the home team having 0.540 WE. That means if they put up a scoreless first, they have a nearly 60 percent WE when coming to bat. This might make sense at first, but after further examination I prefer the FanGraphs method, where the WE starts at 50 percent.
The main question people ask upon hearing this is, “If a home team wins 54 percent of the time, shouldn’t we take that into account?” If we take that into account, however, where do we stop? We know that Johan Santana wins a certain percentage of his games. Why not adjust WPA at the start of the game to reflect this? Why not adjust for day and night games? Weekday and weekend? There are so many pre-game factors involved that it’s best to strip all bias and start everyone on equal footing.
What about those weird graphs?

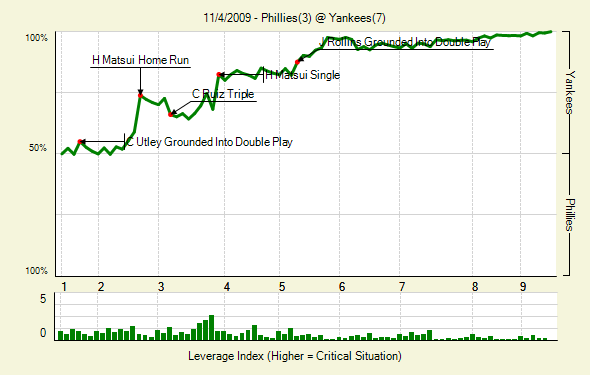
Above is the WPA graph for World Series Game 6. Pretty boring, eh? If that were a normal game in June, we wouldn’t much care for it. Unfortunately, the WPA graph doesn’t adjust for the home team’s fans’ excitement.
The graph is relatively self-explanatory. The green line tracks the WE as the game goes along. As it draws closer to the bottom, the visiting team has the advantage. As it draws closer to the top, the home team has the advantage.
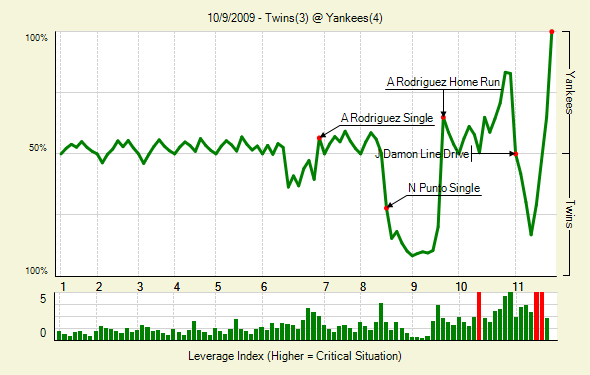
For a more interesting WPA graph:

Next up: what’s that bar graph at the bottom?
Leverage Index
The concept of clutch hitting has permeated baseball since its inception. Some players rise to the occasion, while others don’t. Until LI, we had no real way of measuring clutch ability. We just worked off anecdotal evidence of of writers and fans touting some players while eviscerating others. With Leverage Index, though, we can determine just how important a situation is, and then how players performed in those situations.
A situation with a LI of 1 is considered average. The higher the number, the more crucial the situation. If the number falls below one, it is considered a relatively unimportant situation. Leverage index considers the base, out, and score situation, so at-bats in the ninth inning of a one-run game will count for much more than a comparable situation in the third.
For example, if the home team has the bases loaded with two outs in the bottom of the second , down by one run, the LI in that situation is 3.1. The same situation, but in the bottom of the ninth, yields the highest possible LI, 10.9. You can find a full chart of LI by inning/base/out situation in the resources section.
Any questions?
This is the toughest statistic for me explain, because I’m so familiar with it. I’ve been using and examining WPA for almost five years now, so what seem self-evident to me might not to others. Make sure to ask any questions in the comments, or email them to me. I’m more than willing to edit this guide so it’s as accurate and comprehensive as possible when we create our full guide.
Resources
The One About Win Probability
Get to Know: Leverage Index
Crucial Situations: Part 1, Part 2, Part 3
Leverage Index table
Win Expectancy Finder
Leave a Reply
You must be logged in to post a comment.